Part Three: now we understand how advertising fits into our overall strategy, and how Facebook ads can help us laser-target our ideal audience and track our results, it’s time to look at how we can tweak and optimise our campaigns to get the best results – and make our budget work harder for us (and get a better ROI).

“Most of the world will make decisions by either guessing or using their gut. They will be either lucky or wrong.”
In the previous sessions, we talked about how advertising can help scale up what’s already working, how it fits into your overall strategy, and how to start building your “system” to make sure ads work for you.
Now, we’re diving into some of the more advanced tactics… but first, a little explanation.
You see, it’s extremely unlikely that your first campaign will be a runaway success. Chances are, your first campaigns will vary somewhere between “awful” and “meh”.
And this is fine. Because we don’t know what works yet.
And, in fact, there is no “blueprint” for what works. It depends on your circumstances, your business, your books.

The genre you write in, your budget, your audience, your reach, your covers, descriptions, prices, and a whole host of other factors will dramatically affect “what works” for you.
So, I’m not going to tell you “these exact campaign settings will work for you”. Because that would be a lie.
But what I CAN show you is how to FIND OUT FOR YOURSELF what works for your unique circumstances – I’ll show you how to find your best audiences and optimise your “meh” campaigns into campaigns that you’ll want to scale up as much as you can afford.
And we can do that with data.
Facebook is a CLEAR winner in the race to get author advertisers the best data. You can discover the exact demographics of the audiences most likely to convert – right down to their age, gender, location, marital status, behaviours, and a ton of other factors.
This data is a powerful tool that so many authors don’t use – and it’s often what’s going to turn your “meh” ads into great ones.
Here’s how we can turn an under-performing campaign into a successful one – using Facebook’s reporting features and multiple Ad-Sets:
![]()
You won’t know exactly what audiences to target with your first campaign, but that’s fine – at this stage, all we really need is a “good guess”. For the purposes of this explanation, I’ll give you some examples of what we used for my thriller series.
In the first campaign, we went for a relatively broad audience:
We set up a different ad-set for each of those interests (6 ad-sets in total) and ran with a budget of $35 a day over 5 days.
At first glance, as expected, the results were poor:
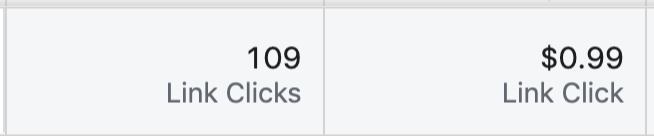
Now, there’s no way we could EVER make a profit on $0.99 clicks unless our $4.99 ebook (book #1 in my series) was converting at record-breaking levels. Which it wasn’t…
Most people would, at this point, call the campaign a failure and move straight on to something else (or give up). But this is just step one.
Because we’d split our interests into separate ad-sets, we could dig a little deeper and see what DID work.
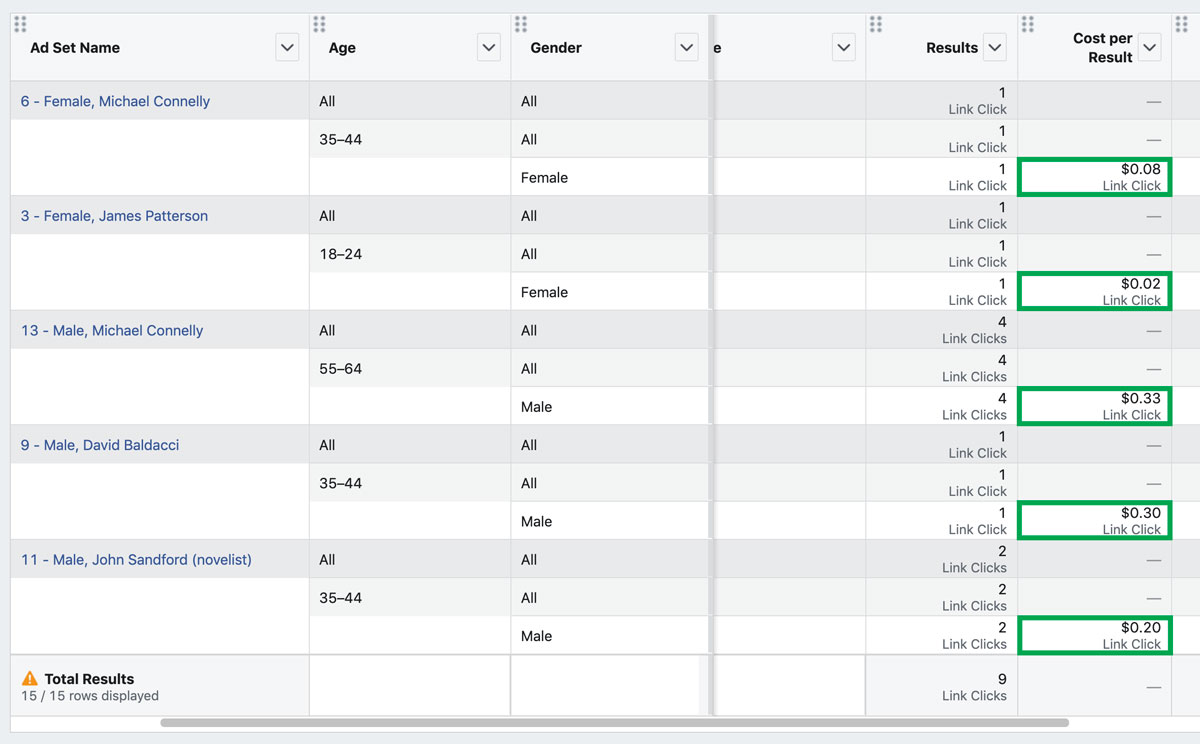
Using Facebook’s Custom Reports, we found a decent chunk of our ads were getting significantly cheaper clicks than the average. In this case, specific combinations of ages, genders, and interests.
So while some of the clicks were horrifically expensive, others were performing well. By setting up our ad with multiple ad-sets and using the custom reports, we could quickly see where to focus for round two.

We took those best performing demographics and created a new campaign, this time with more targeted ad-sets (not just by interest, but by age and gender too).
We set a small budget of $1 per ad-set and saw these results after the first day:
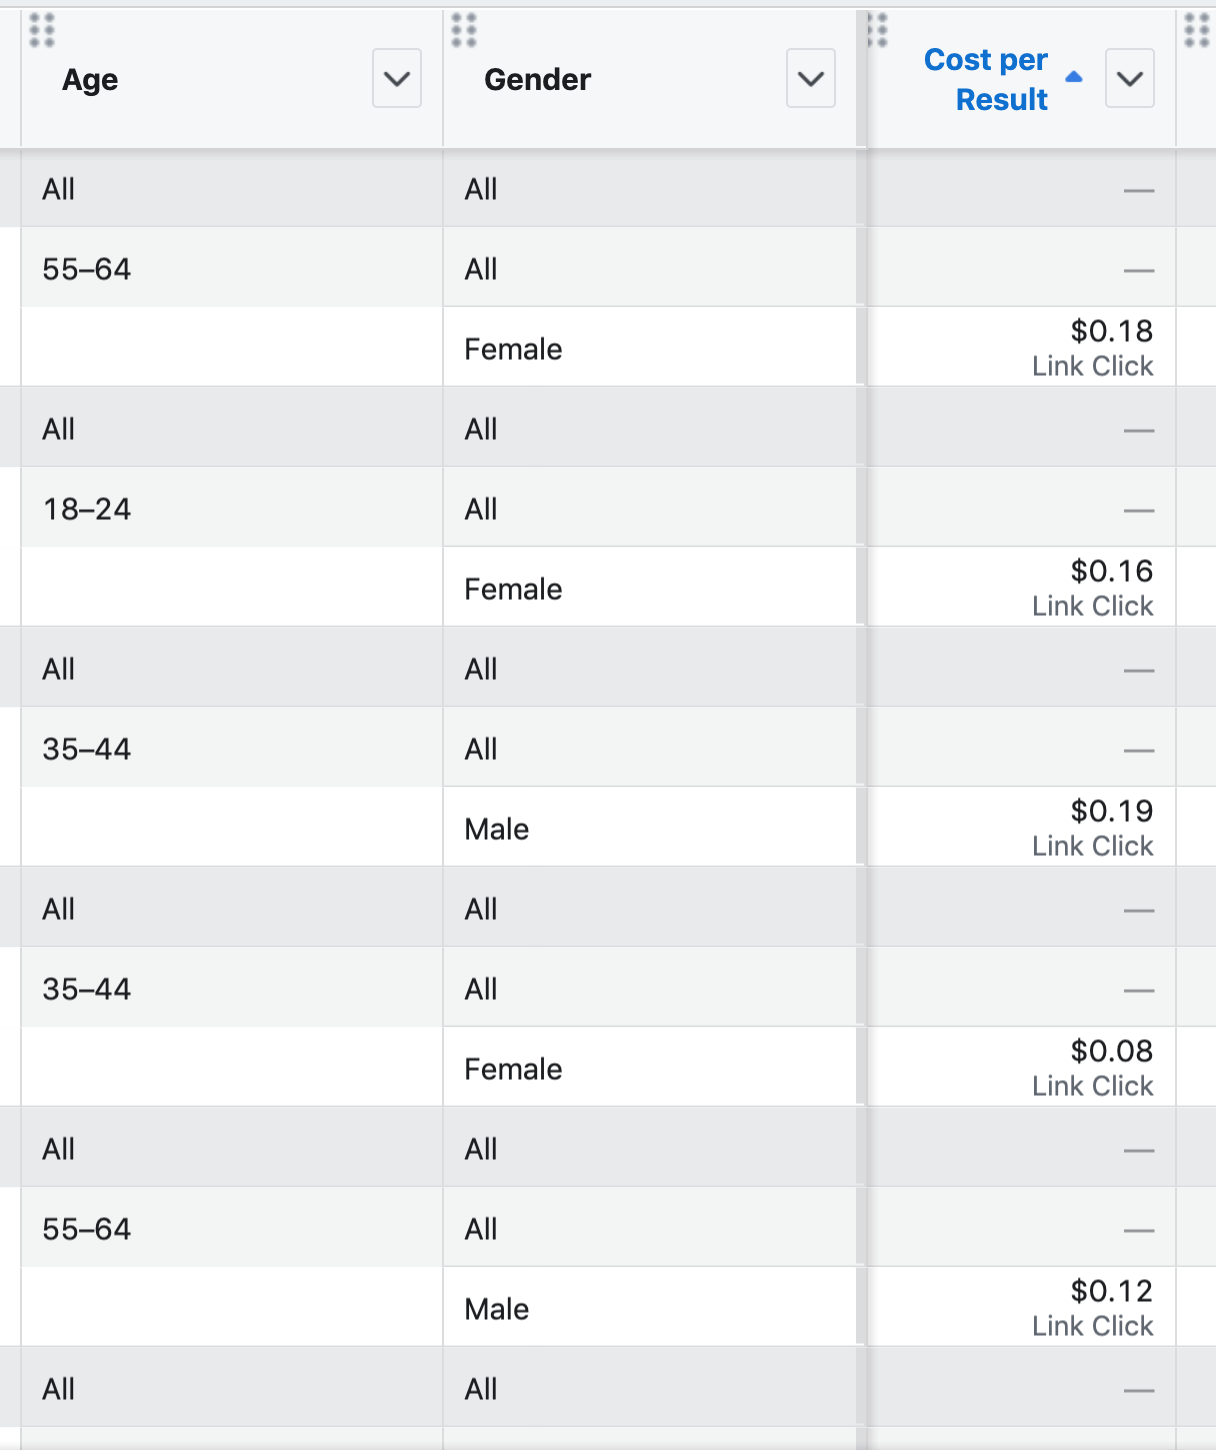
Considerably better results. But what happens when we combine the best groups we’ve seen so far into a new campaign and then let the results settle in a little?
Finally, we ran another campaign with a total of 17 combinations, taken from the best-performing groups of the first two ads. This time, we ran the campaign for 3 weeks:
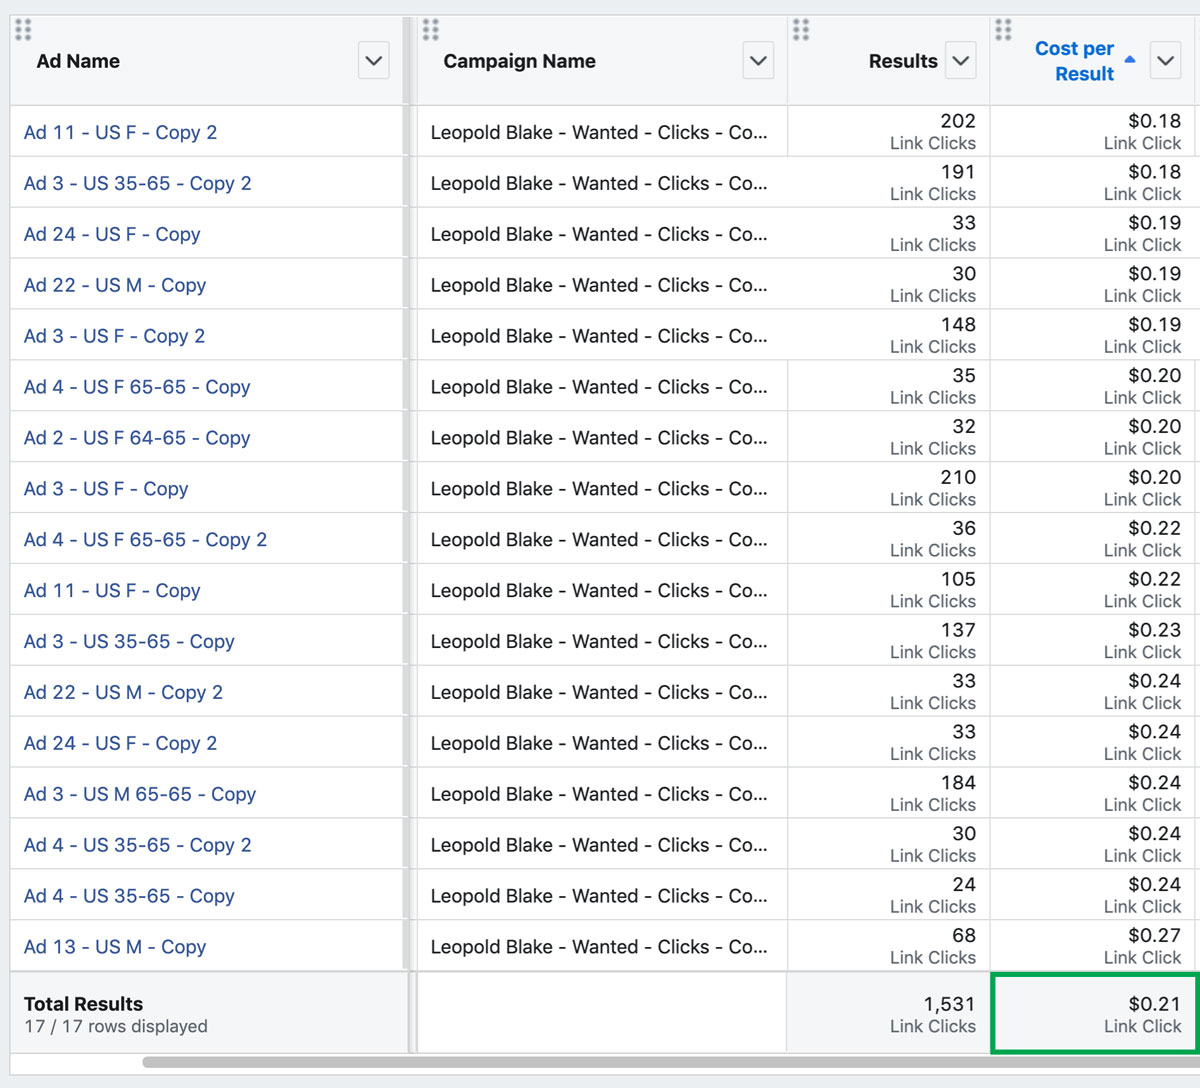
Initially, the average click-cost hovered around $0.14 (an 85% improvement) and by the end of the test period, it had levelled out at $0.21 per click and held there.
The ROI had stayed the same too – the first 2 campaigns had converted at around 2% and the third campaign held on to that, having driven considerably more traffic:
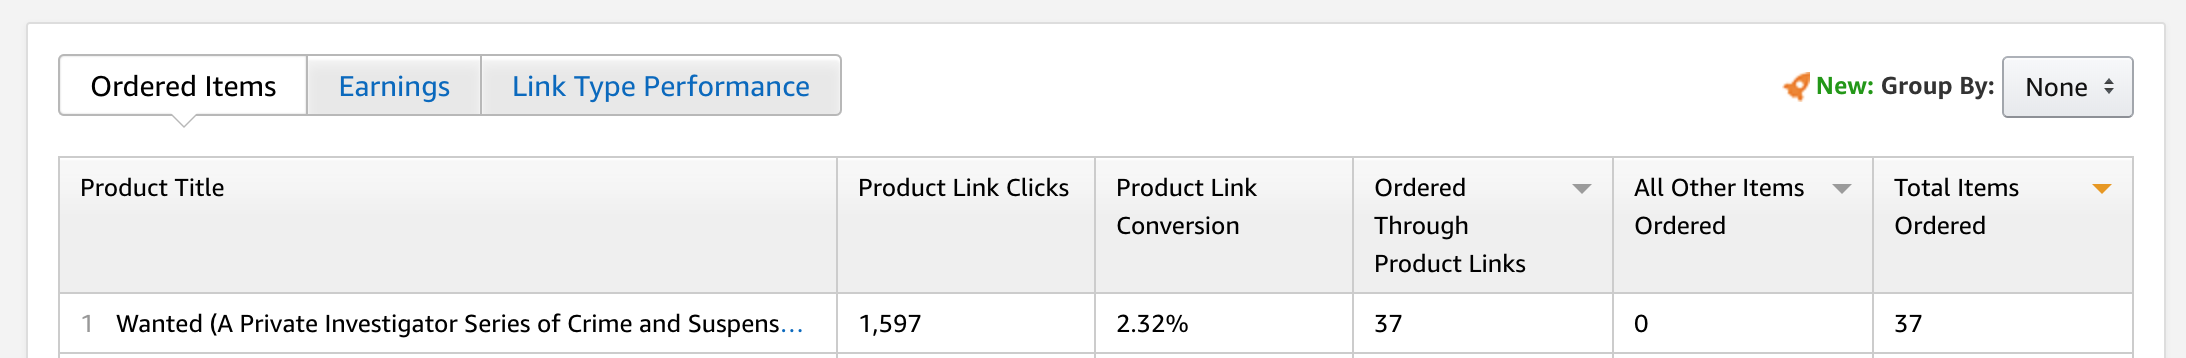
In other words, each sale was costing us around $8.69. On our $4.99 ebook, we’d earn royalties of around $3.60 on each sale. On the face of it, that looks like a loss – but we have to take into account other revenue that isn’t reported:
^^ for more on how to calculate your LTV check out part one
In total, our LTV per sale of book #1 is in the $14 region – taken from the last 90 days of sales and earnings.
Which gives us a total spend of $321 on advertising, for 37 sales at $14 LTV – or $518 total. Or a 61% ROI.
^^ Caveat – you don’t get that LTV all at once. It might come through over the course of several weeks / months, and, of course, you have to wait 60 days for Amazon and the other stores to pay you. Your figures will also be different – so make sure you know your metrics!
But it’s a profit. I knew we could do better, though…

I followed the same process (multiple rounds of optimising) to create a new campaign, this time using a Lookalike Audience with additional interests, again split up into genders and ages at the ad-set level.
Here’s what happened:
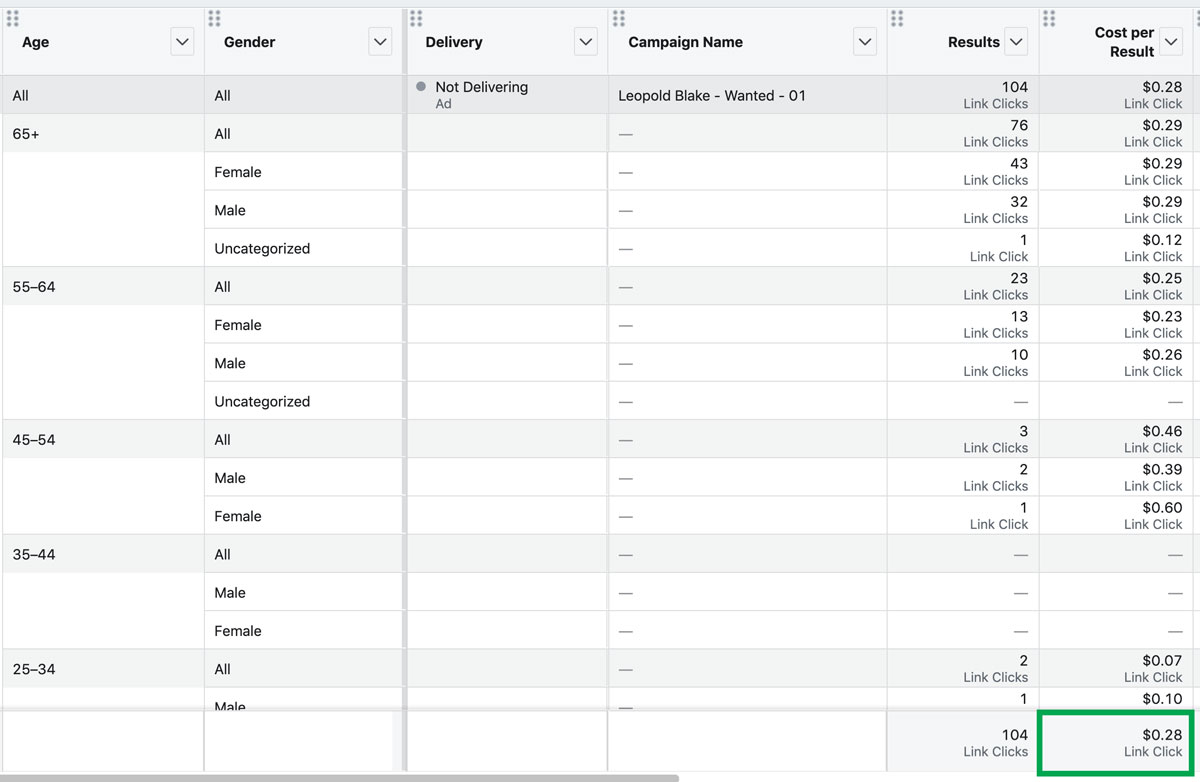
The cost-per-click went UP to $0.28. But that’s only part of the puzzle, remember? We’re reaching a more targeted audience here. Look what happened to the conversion rate:
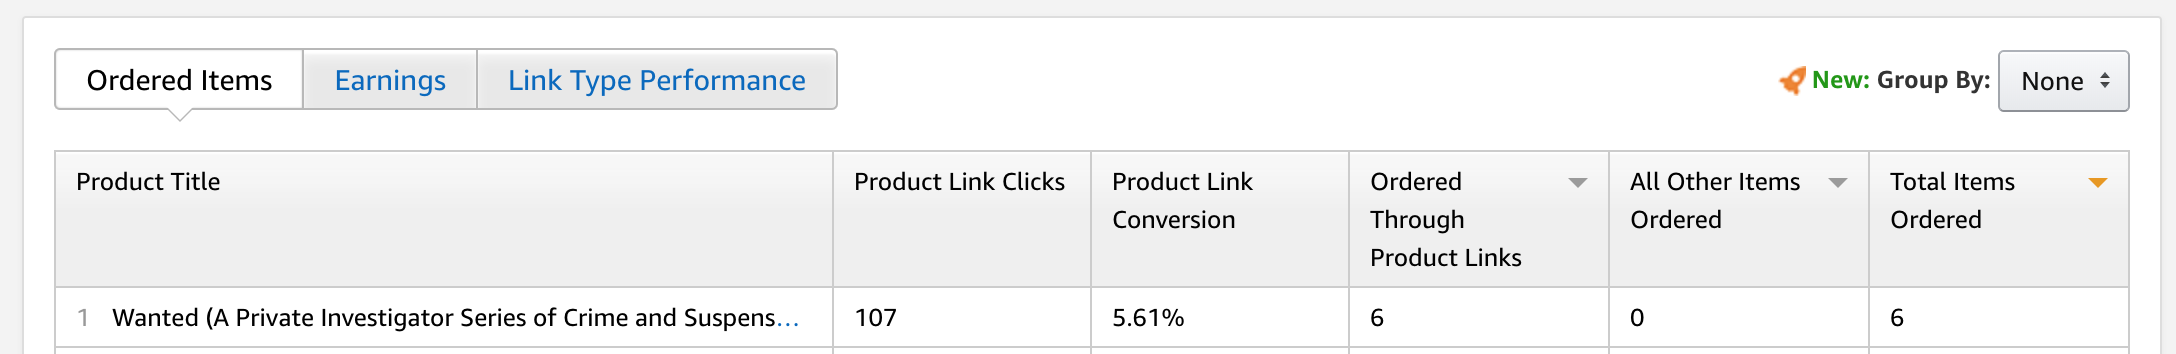
That’s more than double the conversion rate, for a 33% increase in click cost. Or, in other words, where it was costing us $8.61 per sale before, it was only costing us $4.85 per sale with the more targeted ad campaign – or 188% ROI (with that LTV figure of $14 earnings per sale).
If we’d given up after the first campaign ($0.99 per click) we never would have found what worked – and would have continued “guessing” until we either (a) gave up, or (b) somehow stumbled across something that did work, if we got lucky.
I’m not a massive fan of (a) or (b) – so by creating campaigns with multiple (sometimes dozens) of ad-sets running side-by-side, it’s quick and easy to see what’s working and what’s not.
Here’s a video example – after we ran the initial tests and found some great targets, we split that out into 96 different “mini audiences” to see what works. You can see the difference even after just a couple of hours:
Keep doing this until you have enough of an audience to start scaling up. At which point, it’s time to look at how we can increase traffic with those ads without ruining our ROI.
Good – leave a comment below and I’ll get back to you ASAP. If there’s anything specific you’d like me to cover in this series, just let me know!
© Your First 10,000 Readers
Privacy | Terms | Disclaimer